Very simple: creating beautiful charts - that's what graphR. is all about.
The purpose of graphR. is to automatize and simplify the analysis of RVTools exports and to give a visual presentation of the information contained within one Excel export. RVTools is a VMware utility that connects to a vCenter and gathers information with an impressive level of detail on the VMware environment. The data collection is fast and easy. The end result can be stored in a Microsoft Excel file. RVTools exports are a great way to collect data on VMware environments. However, analyzing RVTool exports especially of complex environments can be time-consuming, error-prone and cumbersome.
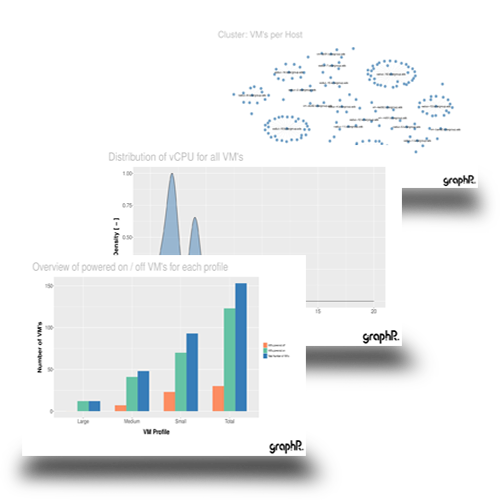
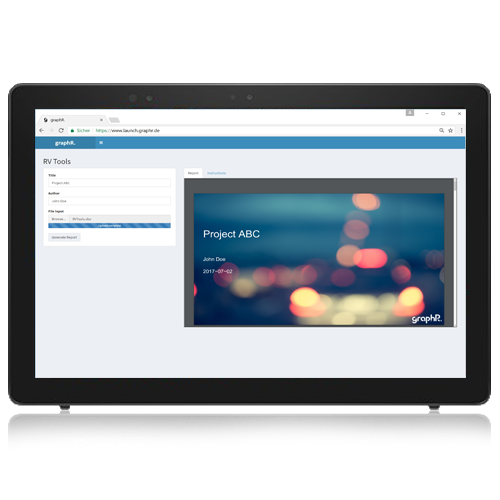
That's where graphR. can help. GraphR. can process RVTools exports saved as Microsoft Excel files. It performs some statistical analysis on the data contained within the Excel files. The dataset is visualized through some beautiful looking diagrams. If the export contains data of more than one datacenter the analysis is performed for each datacenter. Finally all tables and charts are assembled in one downloadable PDF report. Hence graphR. enables to generate a concise report with some great graphics in order to derive meaningful insights on the analyzed VMware enviroment.
Since all tools to build graphR. are freely available and since the source code of graphR. itself is open source the barriers to adjust graphR. to specific use cases should be very low. The core of graphR. is written in R, the open source programming language for statistical computing. The Shiny package is used as the web application framework and finally Docker is used to package all dependencies into one container. The app is available as a Cent OS based container which runs on any container platform.
Stephan is a Solution Architect working at Dell with a focus converged infrastructure and software-defined storage. In his daily job, Stephan consults companies on their IT and cloud agenda and helps them to develop new digital business strategies. Using his scientific knowledge Stephan built graphR. Stephan found RVTools to be very powerful and helpful but the manual way to analyze the exports time-consuming, error-prone and cumbersome. Through the development of graphR. Stephan wants to help automate and simplify the evaluation of RVTool exports. To provide feedback feel free to reach out via mail: graphr.feedback@gmail.com
If you find graphR. helpful please consider supporting the project.